
Message Post-Delivery Analysis Using Microsoft Sentinel To Improve Email Threat Detection and Response
We helped a customer understand their inbound threat detection and response effectiveness and make a data-driven decision on how to improve it.
TLDR; After a recent Red Team engagement, a Stratum customer felt that Microsoft's Exchange Online Protection spam/phishing filters weren't working as well as they should. We helped the customer make a data-driven (and less feeling-based) decision using MS Sentinel to gather data, identify areas of improvement, understand tradeoffs, and make a decision on what security controls to add. The KQL queries are in the post below.
During a recent Stratum Security Red Team engagement, we identified that a customer's inbound email threat detection/prevention was lacking. We see this a lot as part of our Microsoft 365 Cloud Security Reviews. The customer had spent time tuning their anti-spam/phishing policies within Exchange Online Protection (EOP), but malicious messages were still being delivered to users' inboxes. The customer-created policies were configured a few years ago, and the customer was (understandably) concerned about making any changes to things that impact inbound mail flow. The customer asked Stratum for guidance on how they could make a data-driven decision on what to do. Since they sent their Exchange data to Sentinel, we helped them run some queries to get the data we needed.
In this post, I will start with a very broad query that returns a ton of results and add to it until we get to a query that returns just the data we need and can be used for very useful reports, dashboards, etc. This is how I learned KQL (with a ton of help from ChatGPT).
Before we begin, I should note that email filtering providers do not publicize how their filters work, which is understandable. I am making some assumptions on how things work based on my experience working around spam filters since I was a Network Abuse Admin at EarthLink Network in 1997, co-founding ThreatSim, a phishing simulation platform, and experience performing red team engagements.
First, we wanted to understand the volume of their total inbound email flow within a static 40-day Window:
Show all inbound emails sent from external senders that don't have a From: line of acme-corp.com:
EmailEvents
| where TimeGenerated >= datetime(2024-01-01) and TimeGenerated <= datetime(2024-02-08)
| where EmailDirection == "Inbound"
| where SenderFromDomain !has "acme-corp.com"
Note: This excludes senders spoofing the customer's domain, which is fine, as the customer had domain impersonation controls, and the number was not material.
One of the challenges is that this returned more than 30k results. You can append | count on the last line and the Sentinel interface will produce the number of matches without showing the data. If you want to see results over 30k, you must use Azure Data Explorer using this connection string:
https://ade.loganalytics.io/subscriptions/<subscription-id>/resourcegroups/log_analytics_sentinel/providers/microsoft.operationalinsights/workspaces/<workspace-name>
Now that we had the number of all inbound emails, we want to see how many of those were dropped by Microsoft right when they hit the mail server:
Show inbound messages that were dropped by EOP upon delivery:
EmailEvents
| where TimeGenerated >= datetime(2024-01-01) and TimeGenerated <= datetime(2024-02-08)
| where EmailDirection == "Inbound"
| where SenderFromDomain !has "acme-corp.com"
| where DeliveryAction == "Junked" or DeliveryAction == "Blocked"
This query showed us that about 25% of all inbound email was dropped by EOP upon delivery. This is due to the customer's spam and phishing controls. Let's dig deeper...
Breakdown inbound messages dropped by EOP upon delivery into Spam or Phish:
EmailEvents
| where TimeGenerated >= datetime(2024-01-01) and TimeGenerated <= datetime(2024-02-08)
| where EmailDirection == "Inbound"
| where SenderFromDomain !has "acme-corp.com"
| where DeliveryAction == "Junked" or DeliveryAction == "Blocked"
| where ThreatTypes == "Spam"
// | where ThreatTypes == "Phish"
Note: To get phish, un-comment the last line and comment out the "Spam" line. We'll talk about a more elegant way to do this later.
Now that we had a breakdown of Phish vs. Spam, we could see the threats that EOP detected by type. EOP performs post-delivery analysis of emails that make it to inboxes. While the exact methods and criteria for the post-delivery analysis is opaque, we can assume that several factors go into EOP deciding that a message they delivered to an inbox is malicious. This may include a mix of threat intelligence updates, user reports within the tenant, user reports across all M365 customers, dynamic analysis (sandboxes), etc. But at some point, EOP says "Whoops, we should not have let that slide, and "ZAPs" the message (Zero-hour Auto Purge).
To list messages that were delivered to user inboxes but later determined to be malicious by EOP, we need first to add a DeliverAction filter to show messages that were Delivered and the DeliveryLocation is the Inbox and then join with the EmailPostDeliveryEvents table. Then we're going to add a filter for messages in the EmailPostDeliveryEvents table that was Moved to quarantine, Moved to junk folder or have an ActionType of Phish ZAP or Spam ZAP. This gets us:
Messages that made it to the user's inbox but were later detected by Microsoft (or reported by the user) as malicious:
EmailEvents
| where TimeGenerated >= datetime(2024-01-01) and TimeGenerated <= datetime(2024-02-08)
| where EmailDirection == "Inbound"
| where SenderFromDomain !has "acme-corp.com"
| where DeliveryAction == "Delivered" and DeliveryLocation has "Inbox" // The messages that EOP allowed to pass
| join kind=inner (
    EmailPostDeliveryEvents
    | where Action in ("Moved to quarantine", "Moved to junk folder") or ActionType in ("Phish ZAP", "Spam ZAP")
) on InternetMessageId
// When joining tables, sometimes there can be duplicates. The following line de-dupes based on NetworkMessageId to the earliest log entry
| summarize arg_min(TimeGenerated, *) by NetworkMessageId // Deduplicate based on NetworkMessageId
| join kind=leftouter (
    EmailPostDeliveryEvents
    | summarize arg_min(TimeGenerated, *) by NetworkMessageId
    | extend FirstUserDetectedThreatTimeGenerated = TimeGenerated
) on NetworkMessageId
So now have the messages that made it to the user's inbox, exposing them to a potential threat. This is a "failure" of the inbound filtering to keep users from making consequential security decisions.
Next, we're going to see who detected the message as a threat post-delivery with the ActionResult column:
Messages that made it to the user's inbox but were later detected by Microsoft as malicious:
EmailEvents
| where TimeGenerated >= datetime(2024-01-01) and TimeGenerated <= datetime(2024-02-08)
| where EmailDirection == "Inbound"
| where SenderFromDomain !has "acme-corp.com"
| where DeliveryAction == "Delivered" and DeliveryLocation has "Inbox" // The messages that EOP allowed to pass
| join kind=inner (
    EmailPostDeliveryEvents
    | where Action in ("Moved to quarantine", "Moved to junk folder") or ActionType in ("Phish ZAP", "Spam ZAP")
) on InternetMessageId
// When joining tables, sometimes there can be duplicates. The following line de-dupes based on NetworkMessageId to the earliest log entry
| summarize arg_min(TimeGenerated, *) by NetworkMessageId // Deduplicate based on NetworkMessageId
| join kind=leftouter (
    EmailPostDeliveryEvents
    | summarize arg_min(TimeGenerated, *) by NetworkMessageId
    | extend FirstUserDetectedThreatTimeGenerated = TimeGenerated
) on NetworkMessageId
| where ActionResult == "Success" // Success = MSFT detected it
// | where ActionResult == "UserTriaged" // UserTraiaged = The user reported it
Where the ActionType is Success, that is EOP detecting it post-delivery as malicious. An ActionType of UserTriaged is if the user reported it as malicious using Outlook. Toggle the comments above to get counts for each post-delivery detection method.
So now we have metrics of who detected spam and phish after EOP let it through. We can further refine the query to break down the ThreatType:
Messages that made it to the user's inbox but were later detected by Microsoft or the user as malicious by ThreatType:
EmailEvents
| where TimeGenerated >= datetime(2024-01-01) and TimeGenerated <= datetime(2024-02-08)
| where EmailDirection == "Inbound"
| where SenderFromDomain !has "acme-corp.com"
| where DeliveryAction == "Delivered" and DeliveryLocation has "Inbox" // The messages that EOP allowed to pass
| join kind=inner (
    EmailPostDeliveryEvents
    | where Action in ("Moved to quarantine", "Moved to junk folder") or ActionType in ("Phish ZAP", "Spam ZAP")
) on InternetMessageId
// When joining tables, sometimes there can be duplicates. The following line de-dupes based on NetworkMessageId to the earliest log entry
| summarize arg_min(TimeGenerated, *) by NetworkMessageId // Deduplicate based on NetworkMessageId
| join kind=leftouter (
    EmailPostDeliveryEvents
    | summarize arg_min(TimeGenerated, *) by NetworkMessageId
    | extend FirstUserDetectedThreatTimeGenerated = TimeGenerated
) on NetworkMessageId
| where ActionResult == "Success" // Success = MSFT detected it
// | where ActionResult == "UserTriaged" // UserTraiaged = The user reported it
| where ThreatTypes2 == "Spam"
// | where ThreatTypes2 == "Phish"
As in the previous query, you can toggle the comments in the last line to filter for Spam or Phishing to get the data you need.
So the query above shows you the messages that MS detected as Spam or Phishing after delivery. You can swap out Success for UserTraiged to see the stuff that your users reported as malicious.
Let's change the query a bit to extract the message delivery timestamp and the timestamp for when it was marked malicious post delivery. This will tell us the "lag time" for detection.
We are going to add this:
| extend TimeDeltaMinutes = datetime_diff('minute', TimeGenerated1, TimeGenerated)
So now our query looks like this:
EmailEvents
| where TimeGenerated >= datetime(2024-01-01) and TimeGenerated <= datetime(2024-02-08)
| where EmailDirection == "Inbound"
| where SenderFromDomain !has "acme-corp.com"
| where DeliveryAction == "Delivered" and DeliveryLocation has "Inbox" // The messages that EOP allowed to pass
| join kind=inner (
    EmailPostDeliveryEvents
    | where Action in ("Moved to quarantine", "Moved to junk folder") or ActionType in ("Phish ZAP", "Spam ZAP")
) on InternetMessageId
// When joining tables, sometimes there can be duplicates. The following line de-dupes based on NetworkMessageId to the earliest log entry
| summarize arg_min(TimeGenerated, *) by NetworkMessageId // Deduplicate based on NetworkMessageId
| join kind=leftouter (
    EmailPostDeliveryEvents
    | summarize arg_min(TimeGenerated, *) by NetworkMessageId
    | extend FirstUserDetectedThreatTimeGenerated = TimeGenerated
) on NetworkMessageId
| extend TimeDeltaMinutes = datetime_diff('minute', TimeGenerated1, TimeGenerated)
| where ActionResult == "Success" // Success = MSFT detected it
// | where ActionResult == "UserTriaged" // UserTraiaged = The user reported it
| where ThreatTypes2 == "Spam"
// | where ThreatTypes2 == "Phish"
We now have a new column TimeDeltaMinutes which is the delta between the original delivery and when either EOP or the user marked it malicious. (You can comment/uncomment the ActionResult and the ThreatTypes2 values to get the data you need.
Ok, so we now have a query that, with some manual tweaking, can tell you:
- How many emails does your tenant receive in total
- How many emails were filtered by EOP right at delivery
- How many of those emails were phish, spam, etc.
- How many emails were detected by users or EOP (or both)
- How many of those emails were spam, phish, etc.
- The time delta between delivery and detection
It will give you the average time delta, which is nice.
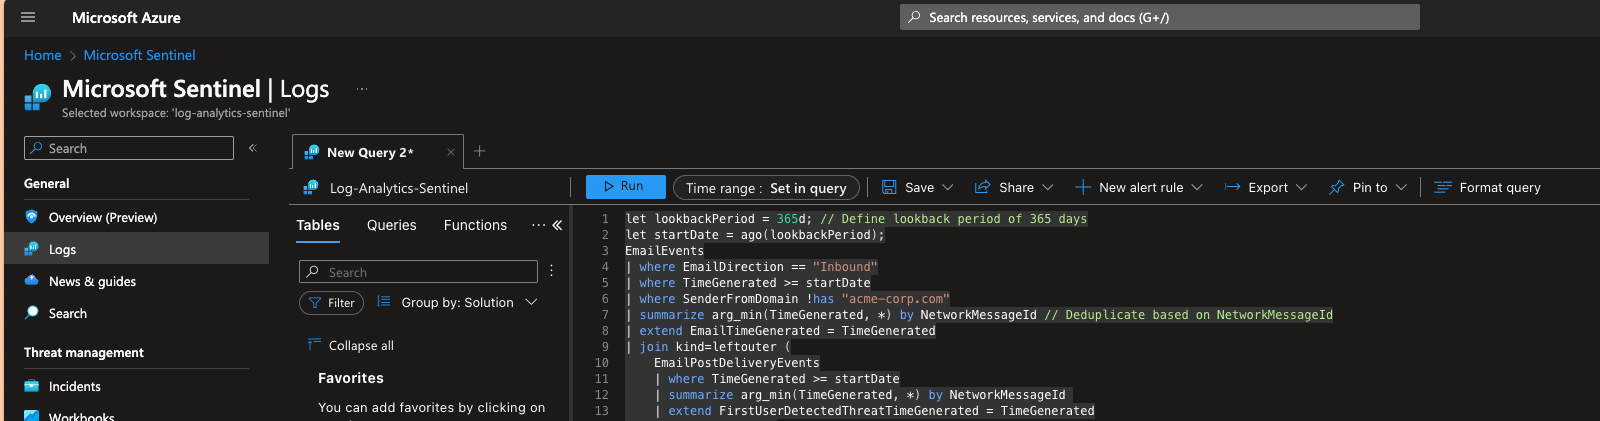
Let's collapse all of this into one query that gives us everything above, in one query, on one page, and breaks down the metrics by week for the last 365 days. Here you go (If you want a detailed explanation of the query, I suggest you drop this in ChatGPT and have it break it down for you):
let lookbackPeriod = 365d; // Define lookback period of 365 days
let startDate = ago(lookbackPeriod);
EmailEvents
| where EmailDirection == "Inbound"
| where TimeGenerated >= startDate
| where SenderFromDomain !has "acme-corp.com"
| summarize arg_min(TimeGenerated, *) by NetworkMessageId // Deduplicate based on NetworkMessageId
| extend EmailTimeGenerated = TimeGenerated
| join kind=leftouter (
    EmailPostDeliveryEvents
    | where TimeGenerated >= startDate
    | summarize arg_min(TimeGenerated, *) by NetworkMessageId
    | extend FirstUserDetectedThreatTimeGenerated = TimeGenerated
) on NetworkMessageId
| project-away TimeGenerated, TimeGenerated1
| extend WeekStart = startofweek(EmailTimeGenerated), // Ensure this aligns with your week start preference
         TimeDeltaUserReported = iif(ActionResult == "UserTriaged", datetime_diff('minute', EmailTimeGenerated, FirstUserDetectedThreatTimeGenerated), int(null)),
         TimeDeltaMSDetected = iif(ActionResult == "Success", datetime_diff('minute', EmailTimeGenerated, FirstUserDetectedThreatTimeGenerated), int(null))
| summarize TotalReceived = count(),
            Blocked = countif(DeliveryAction == "Blocked" or DeliveryAction == "Junked"),
            Allowed = countif(DeliveryAction == "Delivered"),
            ThreatDetectedPostDeliveryTotal = countif(ActionResult == "Success" or ActionResult == "UserTriaged"),
            ThreatDetectedPostDeliveryUserDetected = countif(ActionResult == "UserTriaged"),
            ThreatDetectedPostDeliveryMSDetected = countif(ActionResult == "Success"),
            ThreatDetectedPostDeliveryMSDetectedSpam = countif(ActionResult == "Success" and ThreatTypes1 == "Spam"),
            ThreatDetectedPostDeliveryMSDetectedPhish = countif(ActionResult == "Success" and ThreatTypes1 == "Phish"),
            ThreatDetectedPostDeliveryUserDetectedSpam = countif(ActionResult == "UserTriaged" and ThreatTypes1 == "Spam"),
            ThreatDetectedPostDeliveryUserDetectedPhish = countif(ActionResult == "UserTriaged" and ThreatTypes1 == "Phish"),
            AverageTimeDeltaUserReported = avg(TimeDeltaUserReported),
            AverageTimeDeltaMSDetected = avg(TimeDeltaMSDetected)
by WeekStart
| order by WeekStart asc
Here is what the end result looks like:
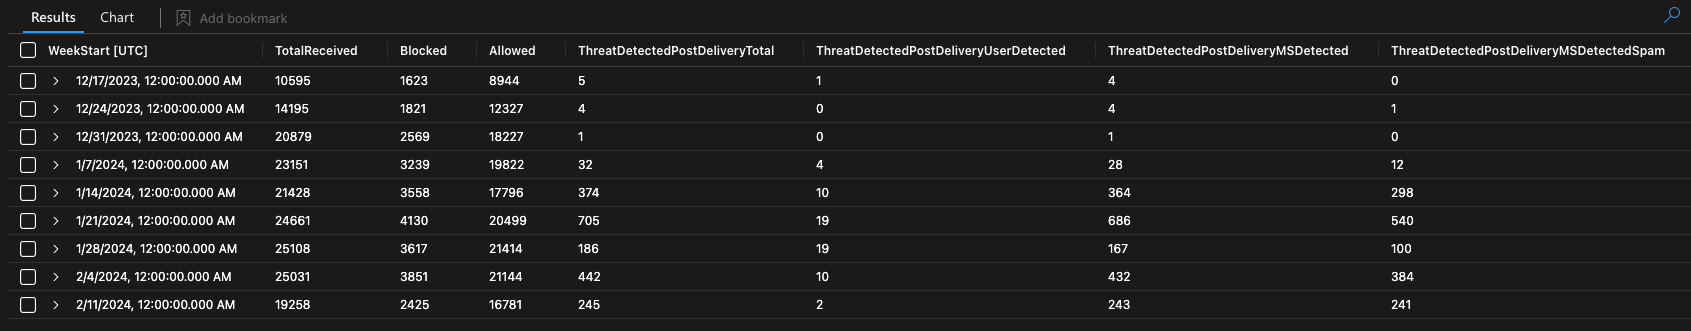
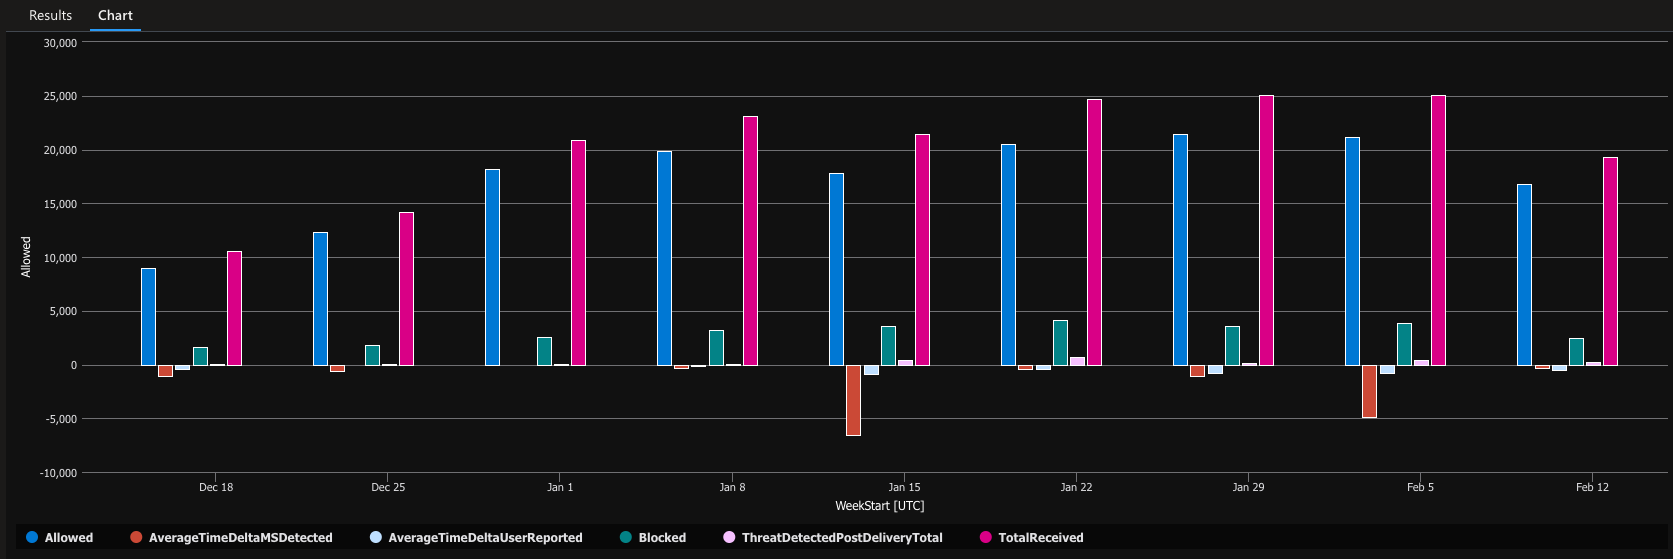
(There is more data to the right). You can use the Sentinel charting functionality to get a graphical representation of the data:
In sum...
While the query above looks at 365d of data week over week, for the purposes of getting the customer data, we looked at all emails from 1/1/24 to 2/8/24. We also manually inspected all post-delivery-detected messages that made it to users' inboxes to determine if the messages were benign or malicious, subjectively. The data tells us these facts:
- In 40 days, users received 124 malicious emails post-delivery
- That is about 3 malicious emails per day. Not great.
- While the customer has other compensating controls (MFA, DNS filtering, web filtering, EDR logging, etc.) this isn't great.
Based on this data, the customer started looking at additional inbound email filtering solutions with a focus on better/faster URL analysis/sandboxing and message content. I'll put together a separate blog post to discuss that effort.
If you found this useful and are looking to test your security posture, please get in touch with us at info@stratumsecurity.com. I'm one of the founders. We're a boutique information security consulting firm that does great and dependable work.